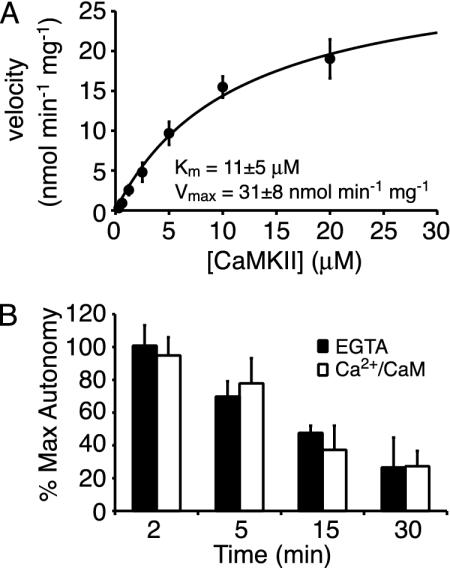
Fig. 4.
Characterization of CaMKII dephosphorylation by PP1. (A) Michaelis-Menton plot of CaMKII dephosphorylation by PP1. Plotted is the velocity of dephosphorylation versus [CaMKII] (±SD, n = 2). The line represents the best fit to the Michaelis-Menton equation. (B) Time course of CaMKII dephosphorylation in the presence and absence of Ca2+. Plotted is the CaMKII autonomy versus time (±SD, n = 2).

