Fig. 5.
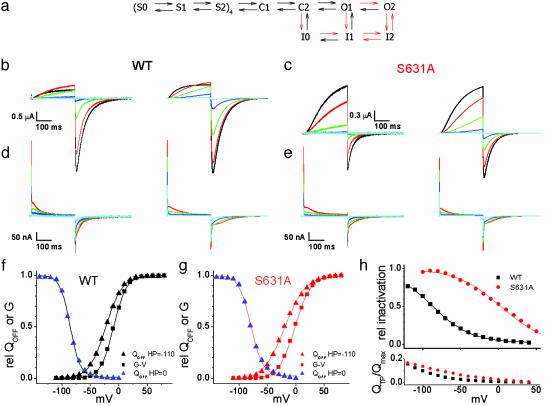
Markov model of WT and S631A HERG channels. (a) Schematic of the Markov state model. The rates and valences for the transitions are presented in Table 1. The forward rates of the transitions marked as red arrows were changed to model S631A behavior as indicated in red text. (b) Ionic currents recorded from WT HERG channels (Left) and currents predicted by the model (Right). Voltages in b-e are indicated by the following colors: black, +30 mV; red, +10 mV; green, -10 mV; blue, -30 mV; cyan, -50 mV. (c) Ionic currents recorded from S631A HERG channels (Left) and currents predicted by the model (Right). (d) Gating currents recorded from WT HERG channels (Left) and predicted by the model (Right). (e) Gating currents recorded from S631A HERG channels (Left) and Ig predicted by the model (Right). (f) WT HERG QOFF-V (HP = -110 mV, V1/2 = -23 mV, and z = 1.8; HP = 0 mV, V1/2 = -86 mV, and z = 2.9) and G-V curves (V1/2 = -9 mV and z = 2.2) predicted by the model. (g) S631A QOFF-V (HP = -110 mV, V1/2 = -20 mV, and z = 1.4; HP = 0 mV, V1/2 = -79 mV, and z = 2.4) and G-V curves (V1/2 = -2mV and z = 1.8) predicted by the model. (h)(Upper) Relative inactivation predicted by the model for a triple pulse protocol as in Fig. 4a. V1/2 and z were -88 mV and 1.0 for WT and +3 mV and 0.9 for S631A. (Lower) QTP/Qmax predicted by the model, as calculated in Fig. 4d.

