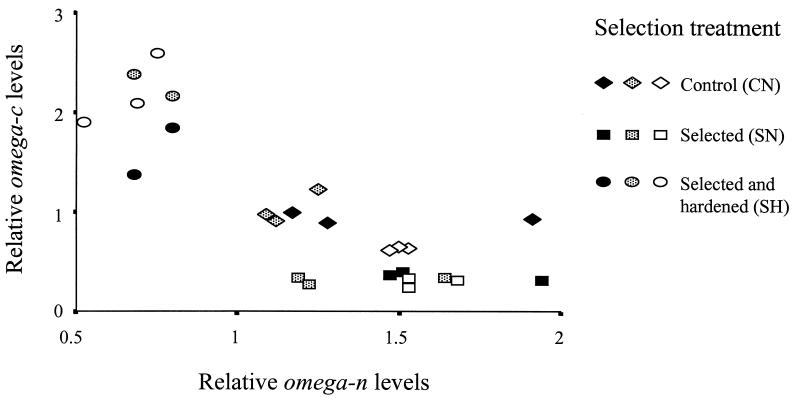
Figure 4.
Scattergram illustrating constitutive levels of hsr-omega RNAs in thermoresistant and control lines. Line designations are described in the text. Different shading of data points within a treatment refer to different replicate lines and at least two independent RNA isolations from each line are shown. Amplicon levels are shown relative to the 0.4 pg of competitor RNA with which they were all coamplified.

