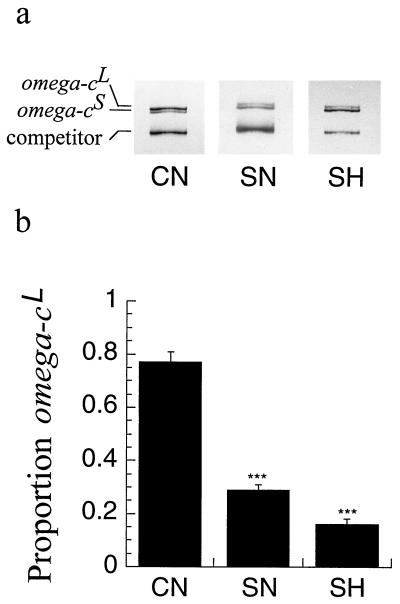
Figure 5.
Quantitation of omega-cL and omega-cS alleles in thermoresistant and control lines (labels as in Fig. 4). (a) Examples of omega-c RT-PCR products from single RNA isolations from each treatment group. (b) Comparison among selected lines of mean (± SE) of omega-cL transcript level expressed as a proportion of total omega-c level in each preparation. Both SN and SH lines differ significantly in omega-cL proportion from the CN lines (data arcsin transformed); ∗∗∗, P < 0.001.

