Figure 1.
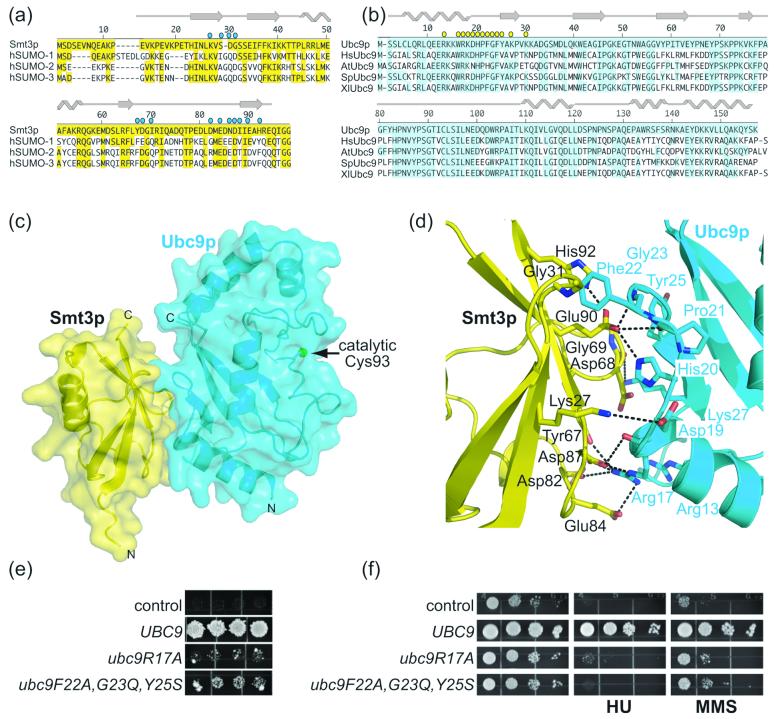
Structure of a Smt3p–Ubc9p complex. a) Sequence alignment of Smt3p from S. cerevisiae and human SUMO-1, SUMO-2, and SUMO-3, with secondary structure elements indicated above, and residues identical to Smt3p highlighted in yellow. Residues in Smt3p that contact Ubc9p are denoted with cyan circles. b) Sequence alignment of Ubc9p from S. cerevisiae with human, A. thaliana, S. pombe, and X. laevis Ubc9. Secondary structure elements are indicated above, and residues identical to S. cerevisiae Ubc9p are highlighted in cyan. Residues in Ubc9p that contact Smt3p are denoted with yellow circles. c) Overall structure of the complex, with Smt3p in yellow and Ubc9p in cyan. Secondary structures are shown overlaid with a semi-transparent surface. Ubc9p's catalytic cysteine (Cys 93) is represented by a green sphere. The crystals form in C2 with a = 120.89 Å, b = 84.58 Å, c = 80.14 Å, and β = 124.31, and two complexes per asymmetric unit. Data were collected using the mail-in program at the 22-BM (SER-CAT, Southeast Regional Collaborative Access Team) beamline at the Advanced Photon Source. Reflection data were indexed, integrated and scaled using HKL2000.50 Initial phases were obtained by molecular replacement using the coordinates of Ubc9p37 as a searchmodel in CNS.51 Electron density for Smt3p was readily visible in initial maps. The model was built manually using O,52 using the previous structures of Smt3p as guides,27; 36 and refined using CNS alternating with cycles of rebuilding relying on simulated-annealing omit and composite omit maps.51 The structure was refined from 50.0 Å to 1.9 Å. The final model has excellent geometry, with no Ramachandran outliers in disallowed regions. Statistics from data collection and refinement are given in Table 1. This and other figures representing structures were generated with Pymol.53 d) Close-up view of the interface between Smt3p and Ubc9p, oriented as in panel c. Smt3p is shown in yellow, with specific residues labeled in black. Ubc9p is shown in cyan, with specific residues labeled cyan. Oxygen atoms are colored red, and nitrogen atoms blue. Hydrogen bonds and salt bridges are represented with dashes. e) ubc9 bearing mutations in interface residues with Smt3p do not complement ubc9Δ cells. In a plasmid shuffle assay, ubc9Δ (PTY30 or PTY34) cells, transformed with a LEU2 vector containing an intron-less cDNA sequence for wild-type UBC9 or the indicated mutant allele expressed from the UBC9 promoter, were spotted onto selective medium supplemented with dextrose, as described previously.37; 54 Individual transformants were successively replica plated onto 5-FOA (US Biological) plates to cure cells of YCpUBC9·U and incubated at 26°C, 30°C, and 36°C.37 Similar results were obtained at all three temperatures, and representative results are shown for the experiment at 30°C. Plasmids were isolated from viable YCpUBC9·U-cured strains and sequenced to verify the identity of the ubc9 allele. f) ubc9 bearing mutations in interface residues with Smt3p do not restore resistance to genotoxic stress. The ubc9-10 mutant strain of S. cerevisiae, bearing a ubc9P123L conditional mutation, was shown previously to display increased sensitivity to a wide range of DNA damaging agents including hydroxyurea (HU) and methyl methane sulfonate (MMS).54 Exponentially growing cultures of ubc9-10 cells (A595=0.3) transformed with the indicated plasmids were serially 10-fold diluted and 5 μl aliquots were spotted onto the appropriate selective media supplemented with dextrose and incubated at 36°C. To assay cell sensitivity to HU or MMS, plates were supplemented with 5 mg/ml HU or 0.0125% MMS, respectively.37

