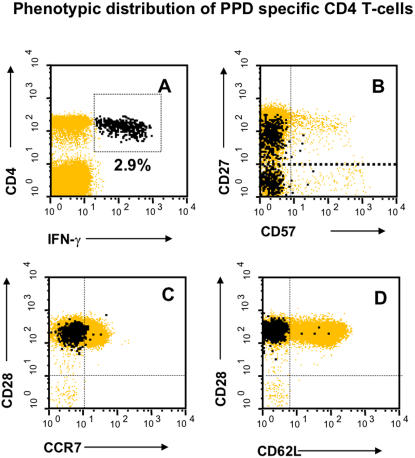
Figure 2. Distribution of tuberculin-reactive CD4 T-cells among the subsets defined by classic memory/naïve markers.
PBMC were stained with the indicated monoclonal antibodies. Panel A shows CD3 T-cells, panels B-D only CD4 T-cells. IFN-γ-producing ex-vivo tuberculin-reactive events are highlighted black. The dotted horizontal line in B shows the limit set for CD27-positivity. Representative results from one patient with active TB are shown.

