
Figure 2.
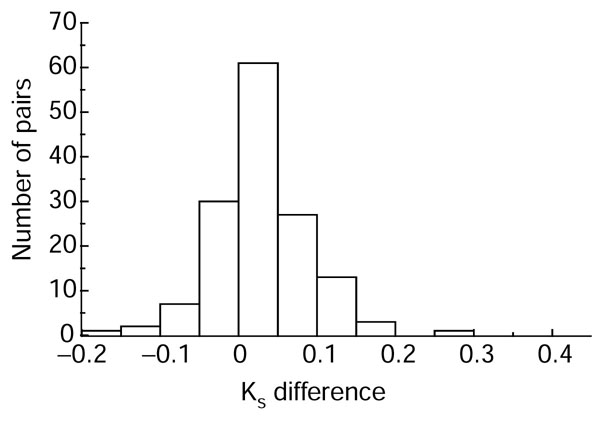
Distribution of Ks differences between duplicate genes for gene pairs with different amino-acid substitution rates. The x axis is the Ks difference between duplicate genes (the Ks of the fast-evolving copy minus the Ks of the slow-evolving one). The y axis is the number of gene pairs within a Ks bin. This figure shows that most pairs have a positive Ks difference, which suggests that the fast-evolving copy usually has a higher Ks than the slow-evolving copy.