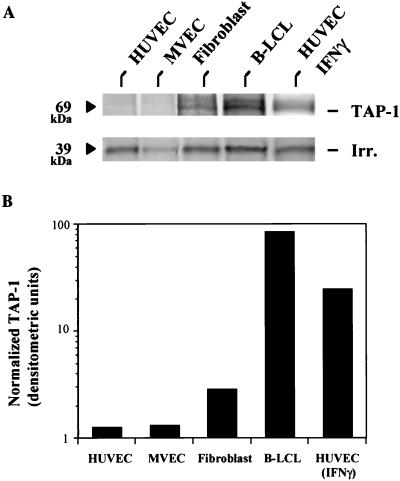
Figure 4.
TAP-1 expression in a panel of syngeneic cell lines. HUVECs, MVECs, fibroblasts, B-LCLs, and IFN-γ-treated (for 18 hr) HUVECs, all isolated from the same donor, were 35S-labeled for 4 hr. Upon cell lysis, equal amounts of labeled protein extracts (based on total protein and acid-precipitable counts) were used for immunoprecipitation. (A) The 69-kDa immunoprecipitated TAP-1 band and an irrelevant (39 kDa) band seen in are in all lanes. (B) The densitometric analysis for A, with normalization to the irrelevant band.

