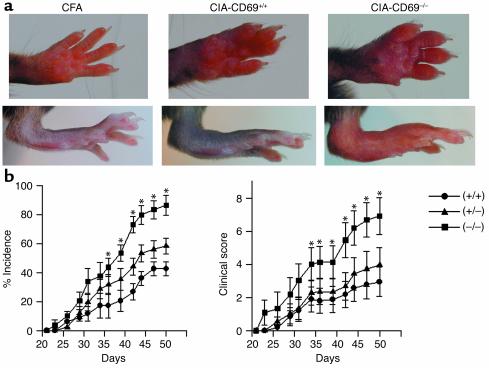
Figure 1.
Exacerbated CIA in CD69–/– mice. (a) CFA-treated control mice (left panels) are compared with representative pictures of the most severe cases of CIA in CD69+/+ mice and CD69–/–mice (middle and right panels, respectively). (b) Incidence of arthritis (percentage of diseased mice) and severity of clinical signs in CD69+/+ (circles), CD69+/– (triangles), and CD69–/– (squares) mice evaluated as described in Methods. Results correspond to the arithmetic mean ± SD from three separate experiments (18 mice per group per experiment). *P < 0.01 versus CD69+/+ (Student’s t test).

