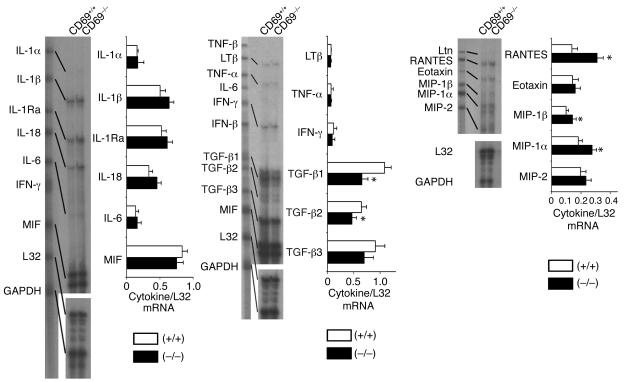
Figure 4.
Local cytokine mRNA analysis in CII-immunized CD69–/– mice. mRNA analysis of CIA CD69+/+ (white bars) and CD69–/– (black bars) mouse hind paws. Each lane corresponds to the mRNA pool of six mice per group, and each bar represents similar experiments (six mice per group per experiment). Results are expressed in arbitrary densitometric units normalized for expression of the ribosomal housekeeping protein L32 in each sample (arithmetic mean ± SD of four separate experiments). *P < 0.01 versus CD69+/+ (Mann-Whitney U test). MIF, macrophage inhibitory factor; LTβ, lymphotoxin-β; Ltn, lymphotoxin.

