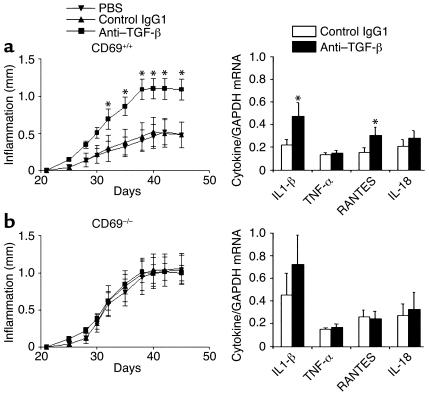
Figure 6.
Effect of a blocking anti–TGF-β antibody in WT and CD69-deficient mice. (a) As shown in the left panel, CD69+/+ mice were treated from day 21 (second immunization) with the blocking anti–TGF-β antibody (squares), the isotype control IgG1 (triangles), or the carrier (inverted triangles). Paw inflammation measured with a precision caliper is expressed in millimeters of inflammation with respect to day 21. Results express the arithmetic mean ± SD of 12 mice per group in two independent experiments. On the right, analysis by quantitative real-time RT-PCR of mRNA from paws treated with isotype control antibody (white bars) or with anti–TGF-β (black bars) is shown. Each bar represents the arithmetic mean ± SD of 12 mice per group in two independent experiments. Results of each cytokine are normalized to GAPDH expression measured in parallel in each sample. *P < 0.01 versus control antibody (Mann-Whitney U test). (b) CD69–/– mice were treated as in a, paw inflammation was measured (left panel), and mRNA was determined (right panel) as above.

