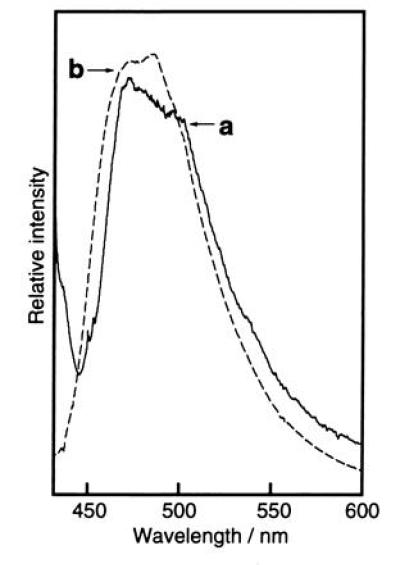
Figure 5.

Fluorescence emission spectra of lysyl endopeptidase digest of GFP and compound 1 in ethanol glass at 77 K. Traces: a, digest of GFP in ethanol containing 0.1 M NaOH aqueous solution, 1% (vol/vol); b, compound 1 dissolved in ethanol containing 0.1 M NaOH aqueous solution, [% (vol/vol)] Estimated original concentration of GFP = 5.5 × 10⁻⁷ M; concentration of compound 1 = 5.0 × 10⁻⁷ M.
