FIG. 1.
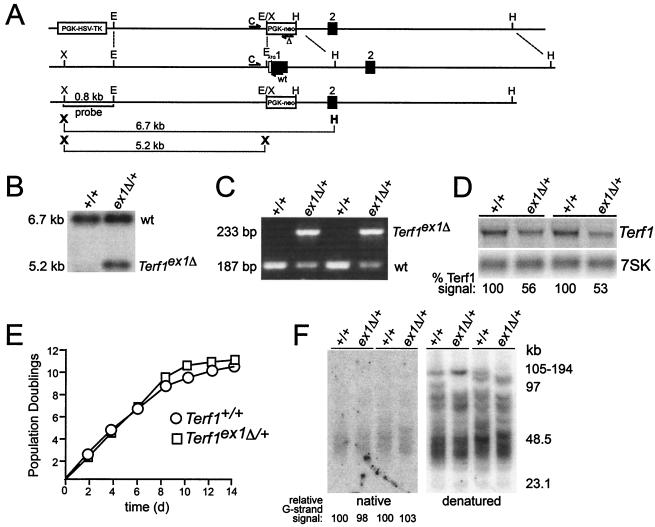
Targeted deletion of exon 1 of the mouse Terf1 locus. (A) Schematics of the targeting construct (top line), wild-type locus (second line), and targeted locus (third line) are shown. The bottom line shows the XhoI/HindIII and XhoI fragments used for genotyping. X, XhoI; E, EcoRI; H, HindIII. Positions of PCR primers used for genotyping are indicated by half arrows. Primers are as follows: C, shared by the wild-type and the targeted allele; wt, wild-type allele-specific primer; Δ, primer specific for the targeted allele. (B) Southern blot of XhoI/HindIII-digested DNA from ES cells of the indicated genotypes. The probe is the 0.8-kb XhoI/EcoRI fragment shown in panel A. (C) PCR of wild-type and Terf1ex1Δ/+ ES cells. (D) Northern blot of total RNA from Terf1+/+ and Terf1ex1Δ/+ MEFs. Total RNA was hybridized first with radiolabeled Terf1 cDNA and subsequently with two oligonucleotides complementary to 7SK RNAs. “% Terf1 signal” refers to the signal derived from hybridization with the Terf1 cDNA normalized to loading (7SK signal). (E) Growth curves of Terf1+/+ and Terf1ex1Δ/+ MEFs from E12.5 embryos. (F) Telomeric overhangs and telomeric restriction fragments from Terf1+/+ and Terf1ex1Δ/+ MEFs obtained from littermates from two different litters. Molecular size markers are indicated in kilobase pairs. Relative G-strand overhang intensities were determined by normalization of the native (G-strand) signal to the signal obtained after denaturation (representing duplex TTAGGG repeats). The ratio of G-strand to duplex signals was arbitrarily set to 100 for the DNA in the first lane, and the other ratios were normalized to this value.

