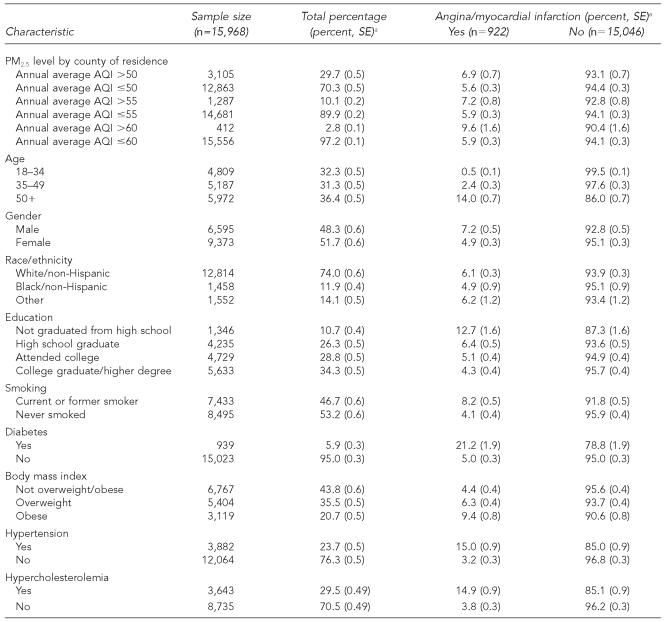
Table 1.
Distribution of ischemic heart disease by risk factors in 51 counties in the U.S., 2001
Percentage and SE are calculated based on weighted sample using SUDAAN software. [Research Triangle Institute. SUDAAN User's Manual: Release 9.0. Research Triangle Park (NC): Research Triangle Institute; 2005.]
PM2.5 = Particulate matter 2.5
AQI = air quality index
SE = standard error

