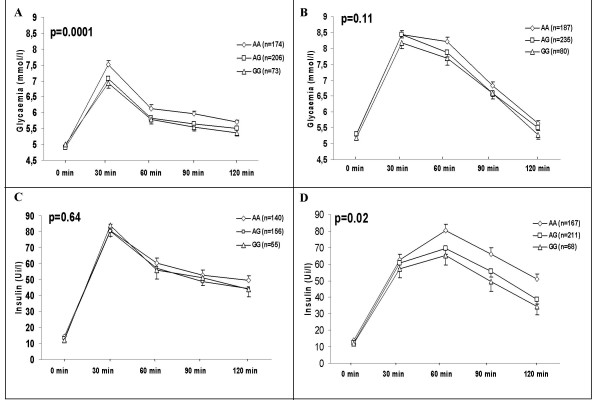
Figure 2.
Plasma glucose (A and B) and plasma insulin (C and D) after OGTTs in obese children (A and C) and obese adults (B and D) according to SNP -1,701A>G (rs11635997) genotypes. Glucose and insulin levels during OGTT were compared using a general linear model ANOVA for repeated measures, adjusted for age, sex, and BMI. P values are for the dominant model (AA vs. AG+GG).

