
Figure 1.
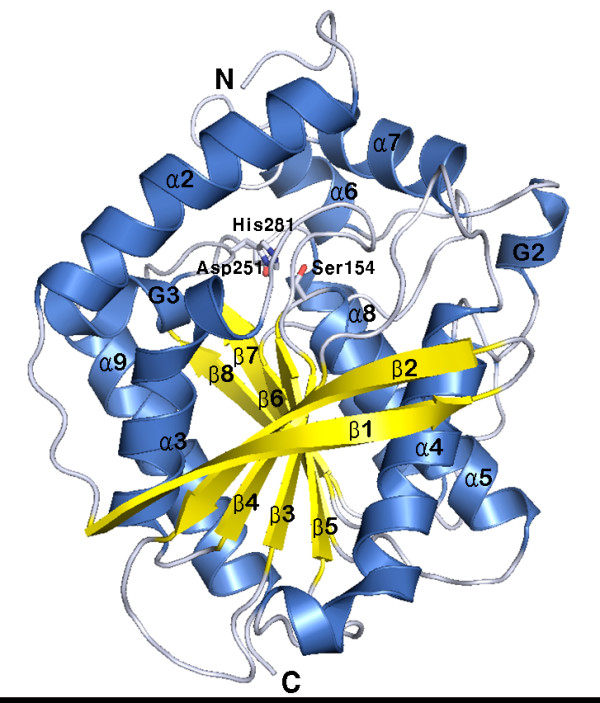
Three-dimensional structure of EstE1. A ribbon diagram of EstE1 shows the eight α-helices and eight β-strands that form a classical α/β hydrolase fold [17]. The α-helical segments and β-strands are shown in blue and yellow, respectively. G2 and G3 represent 310-helices. Helix α1 is not shown because of its disordered electron map. The catalytic triad containing residues Ser154, Asp251, and His281, are shown in stick representation. N and C denote the N and C termini, respectively.