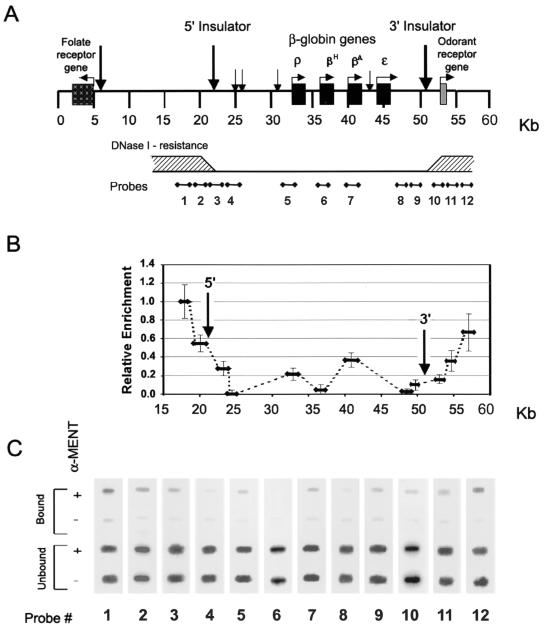
FIG. 2.
Mapping of MENT on the β-globin domain in chicken erythrocytes. (A) A scheme of the β-globin cluster shows the positions of β-globin genes and the map numbering system from reference 43. Vertical arrows indicate the positions of DNase I-hypersensitive sites, including those corresponding to the 5′ and 3′ insulators (58). The lower horizontal bar shows a cumulative scheme of DNase I resistance (shaded areas indicate resistance) derived from several experiments (3, 28, 58, 64). The scheme also shows the positions of hybridization probes 1 to 12 used throughout this work. (B) MENT levels on the chicken β-globin cluster. The graph shows the relative enrichment of MENT at the regions corresponding to the β-globin probes 1 to 12. Error bars indicate standard deviations. (C) Slot hybridization analysis of immunoprecipitated MENT-DNA complexes from the chicken β-globin cluster. After formaldehyde cross-linking of isolated nuclei, DNA-MENT complexes were immunoprecipitated either with α-MENT (+) or with preimmune serum (−). DNA was purified and hybridized with probes 1 to 12 derived from the chicken β-globin cluster.

