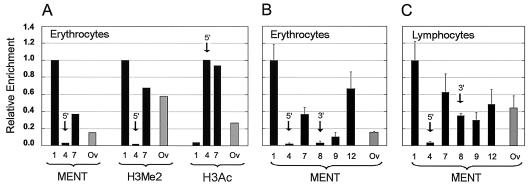
FIG. 3.
MENT levels at selected DNA sequences from chicken blood cells. (A) The histograms show relative enrichment of MENT, H3me2K9 (H3me2), and H3acK9,13 (H3ac) detected by ChIP in chicken erythrocytes. (B and C) The histograms show the relative enrichment of MENT (as related to the probe 1) detected by ChIP with selected genome probes in chicken erythrocytes (A) and lymphocytes (B). DNA probes 1, 4, 5, 7, 8, and 12 (black bars) from the β-globin domain (see Fig. 2A) and Ov (gray bars) from the chicken ovalbumin-coding region, positions 2375 to 3285 (17), were used. Arrows show the probes corresponding to the MENT minimums at the 5′ boundary and the 3′ boundary of the chicken β-globin gene (Fig. 2B).

