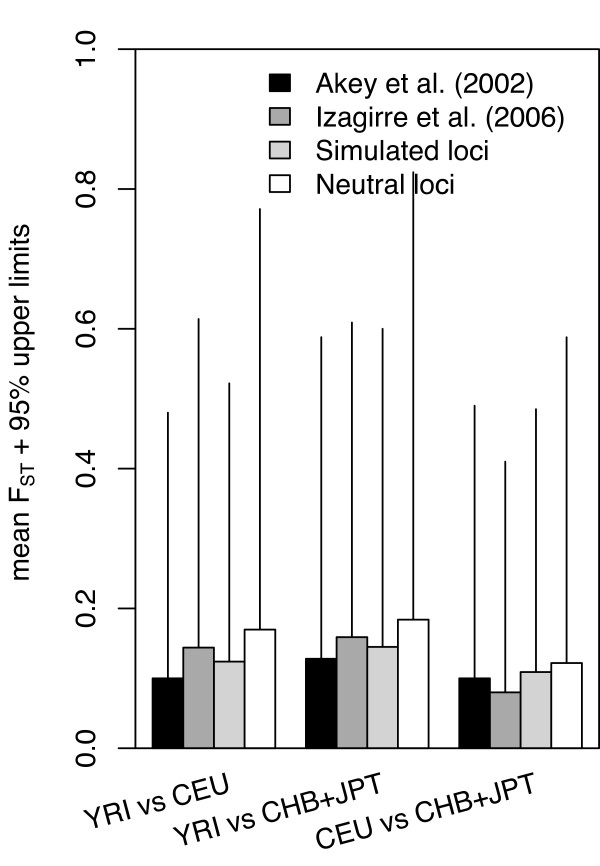
Figure 4.
Mean and 95% upper limits of FST distributions. Black, dark grey, and light grey bars represent the mean of FST distribution found for the autosomal SNPs analyzed in Akey et al. [18], Izagirre et al. [47], and coalescent simulations, respectively. White bars represent the mean of FST in the 'neutral' autosomal loci (14,792 SNPs) from the intergenic regions in this study. The 95% upper limits are placed on top of the mean value of FST.

