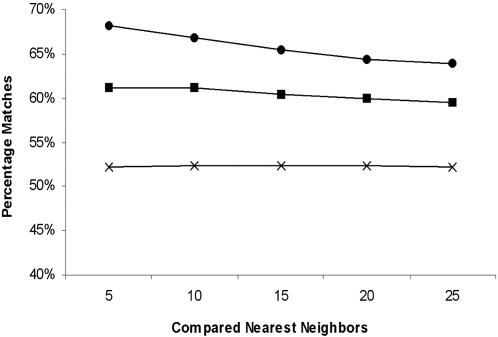
Figure 4. Percentage of comparisons with matches for each prokaryotic species based on an environment and function metric.
The top 5, 10, 15, 20, and 25 nearest neighbors for each prokaryotic species were retained and their corresponding environmental and functional data were compared by computing the average number of matches across nine categories. This analysis was performed for prokaryotes on the niche map (circles) and the phylogenetic map (squares) as shown. In all cases, sequencing bias was taken into account by disregarding all pairs of prokaryotic species that had a Jaccard coefficient greater than 0.90 based on Pfam profile analysis (see Materials and Methods). A control (average of 10 trials) was also performed by randomizing the nearest neighbors for each prokaryotic species (hashes). Error bars for all three analyses are too small to be displayed.

