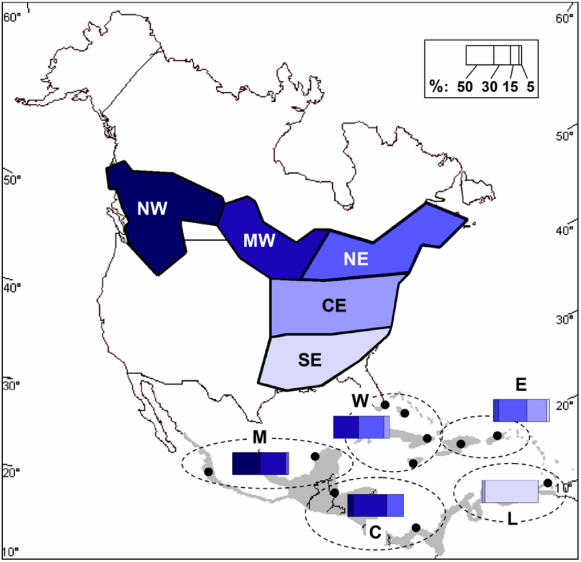
Figure 1. Patterns of connectivity in American redstarts.
The distribution of the most likely breeding region (NW, Northwest; MW, Midwest; NE, Northeast; CE, Central-east; SE, Southeast) for individuals at each wintering region (M, Mexico; C, Central America; W, Western Greater Antilles; E, Eastern Greater Antilles; L, Lesser Antilles/South America). Black dots indicate sampling locations and bars indicate the proportion of individuals assigned to each breeding region (rounded to the nearest 5%) [adapted from ref 14].

