
Figure 3.
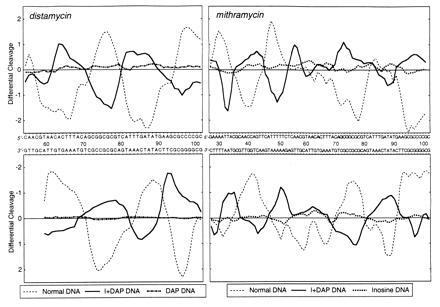
Differential cleavage plots comparing the susceptibility of tyrT(A93) DNA to cutting by DNase I in the presence of distamycin and mithramycin. (Upper) Cleavage of the Watson strand. (Lower) Complementary Crick strand. The ordinate scales for the two strands are inverted, so that deviation of points toward the lettered sequence (negative values) corresponds to a ligand-protected site and deviation away (positive values) represents enhanced cleavage. The values plotted compare the measured probabilities of cleavage expressed in logarithmic units and are smoothed by taking a three-bond running average. The plots drawn as continuous thick lines refer to the doubly substituted I+DAP DNA. Those indicated by dashed lines refer to normal DNA. The plots indicated by dotted and dash-dot lines refer to the G → I- and A → DAP-substituted DNA species, respectively. Note that the sequence printed corresponds to that of natural DNA, though in the modified DNAs adenine and/or guanosine residues are replaced by diaminopurine and/or inosine residues.