
Figure 5.
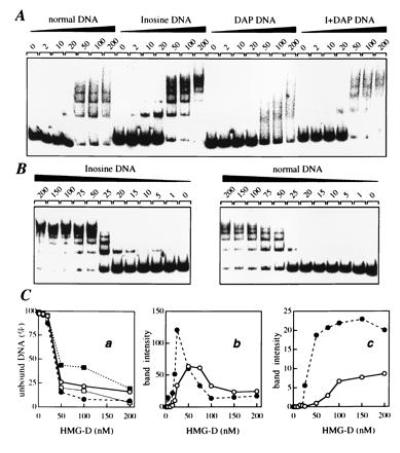
Gel retardation analysis of the interaction of HMG-D protein with normal and substituted tyrT(A93) DNA. (A) Mobility of the normal, inosine-, DAP-, and I+DAP-containing DNAs with various concentrations of HMG-D added (expressed as nM). (B) Study of the binding of HMG-D to normal and inosine-containing DNA in which the concentration of the protein was varied between 1 and 200 nM. (C) Binding to normal DNA (○), inosine-DNA (•), DAP DNA (▪) and I+DAP DNA (□). In Ca the fraction of unbound tyrT(A93) DNA is plotted as a function of HMG-D concentration; in Cb and Cc are shown the fraction of low and high molecular weight complexes formed, the former represented by the nucleoprotein band that migrated fastest in the gel and the latter by the sum of the bands corresponding to multimeric HMG-D/DNA complexes (more severely retarded bands). Data were compiled from quantitative analysis of three independent experiments.