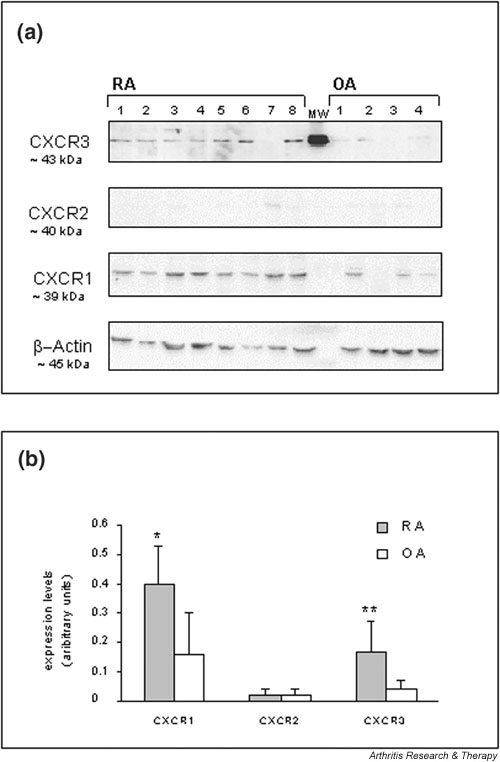
Figure 3.

Western blot analysis of Cys–X–Cys receptor (CXCR)1, CXCR2, and CXCR3 protein expression in selected rheumatoid arthritis (RA) and osteoarthritis (OA) synovial tissues. (a) Tissue extracts from RA (n = 8) and from OA patients (n = 4) were analyzed. Numbered lanes correspond to individual patients within Table 1. Staining of the indicated proteins on parallel blots is shown. Equal loading of tissue extracts was controlled by β-actin protein staining. MW indicates a protein from ECL molecular weight markers. (b) Western blot signals on Hyperfilm™ ECL™ after the chemiluminescence reactions were analyzed semiquantitatively using densitometric scanning. Expression is given in arbitrary units and the means ± SD of the RA and OA groups are plotted. Differences between RA and OA groups were assessed statistically using the Student's t-test (*P < 0.05, **P < 0.01).
