
Figure 2.
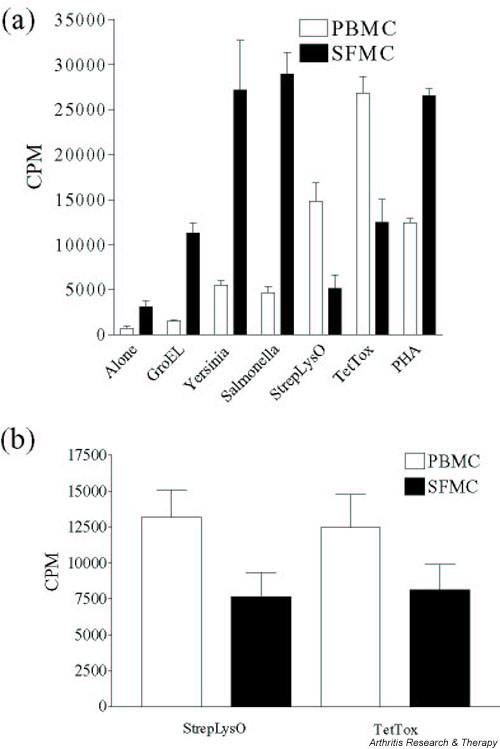
(a) Example of restricted pattern of response to antigens. Bars indicate mean proliferation and standard deviations of triplicate values. (b) The proliferative responses to SLO and TT observed in the patients in the restricted group (n = 19). Responses in the peripheral blood differed significantly to those in the synovial fluid (SLO, P = 0.0057; TT, P = 0.048). CPM, counts per minute; PBMC, peripheral blood mononuclear cells; SFMC, synovial fluid mononuclear cells.