Figure 5.

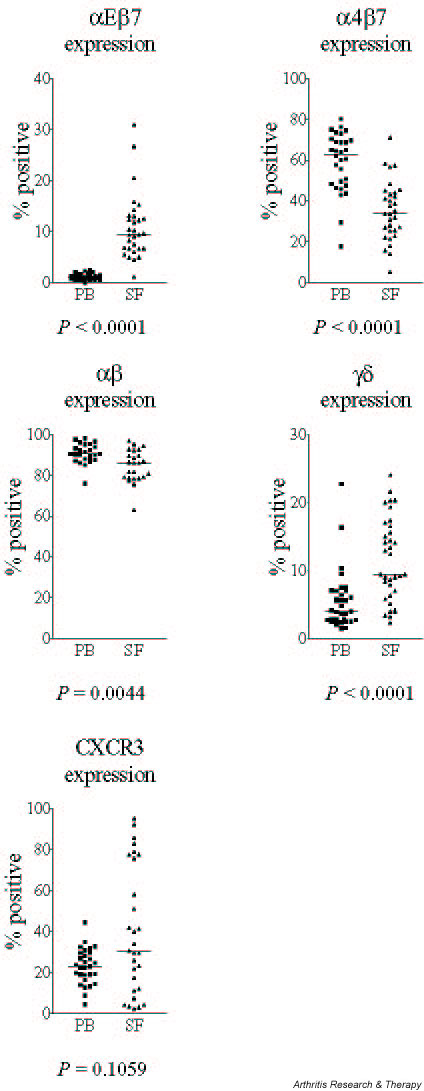
Integrin, TCR and CXCR3 expression on peripheral blood (PB) and synovial fluid (SF) T cells. Histograms represent paired samples from one patient with restricted response.

Integrin, TCR and CXCR3 expression on peripheral blood (PB) and synovial fluid (SF) T cells. Histograms represent paired samples from one patient with restricted response.