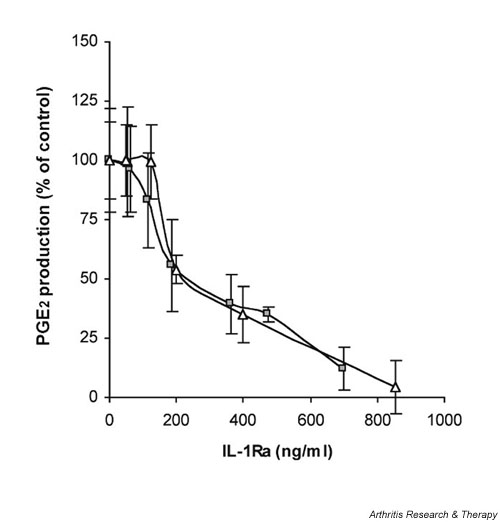
Figure 1.

Comparison of the relative inhibitory activity of recombinant IL-1Ra to HIG-82-IL-1Ra+ cells when added to HSF cultures simultaneous to stimulation with IL-1β. Approximately 5 × 10⁵ HSFs were plated in several wells of a 24-well plate. Twenty-four hours later, a range of doses of rIL-1Ra (from 0.13 to 1 μg) or HIG-82-IL-1Ra+ cells (ranging from 4 × 10² to 4 × 10⁵) was added to individual wells accompanied by 5 ng recombinant IL-1β. Forty-eight hours later the conditioned media were harvested and analyzed for IL-1Ra and PGE2 content by ELISA. PGE2 levels were normalized to control, namely IL-1 stimulated HSF cultures that did not receive IL-1Ra. PGE2 levels from these controls were assigned a value of 100%. The relationship between the relative PGE2 production and IL-1Ra concentration for each treatment group is shown in the graph. The gray boxes represent the PGE2/IL-1Ra levels for the rIL-1Ra treated cultures; white triangles represent those from the cultures receiving the IL-1Ra producing cells. Experiments were performed in triplicate, and each data point represents the mean value ± SD. ELISA = enzyme-linked immunosorbent assay; HSF, human synovial fibroblast; IL-1Ra, IL-1 receptor antagonist; PGE2 prostaglandin E2.
