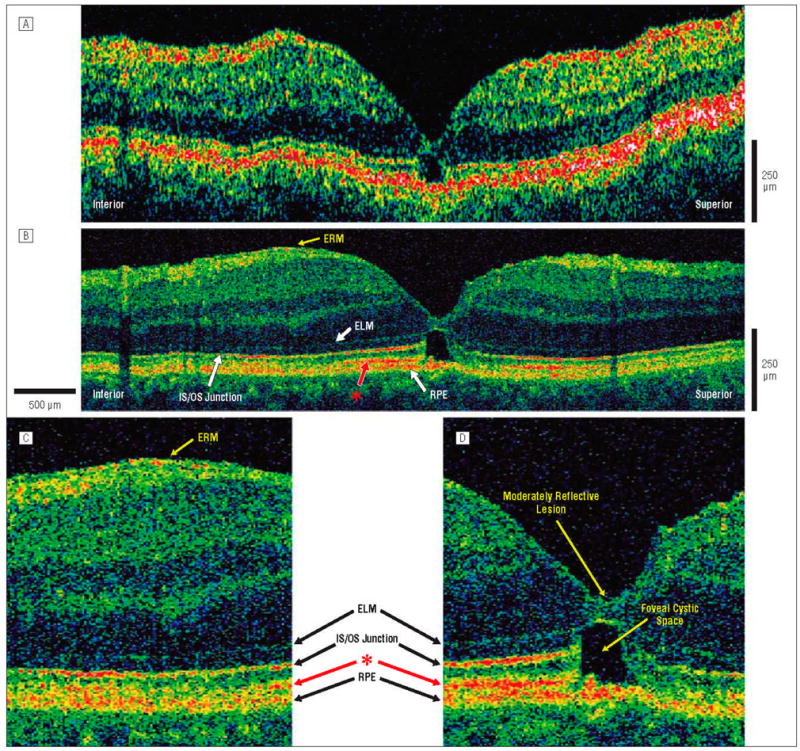
Figure 3.

Postoperative macular hole, 1.25 months after surgical repair. The patient is a 51-year-old man who underwent initial evaluation for a stage 3 macular hole in the left eye and had a preoperative visual acuity of 20/100. He underwent pars plana vitrectomy with internal limiting membrane peel and injection of 25% sulfur hexafluoride gas. One month later, the hole was flat and closed on results of examination, and visual acuity was 20/40. Optical coherence tomography (OCT) images were obtained vertically across the macula in the inferior-superior direction. A, Standard-resolution OCT image acquired in the inferior-superior direction. A hyporeflective disruption in the outer retina is clearly visualized. B, Corresponding UHR-OCT image acquired in the same scan direction. The hyporeflective disruption in the outer retina is likely to be caused by the presence of an outer foveal cystic space. A thin epiretinal membrane (ERM) is present inferior to the fovea. The hyperreflective layer (red asterisk) between the IS/OS junction and RPE appears to stop abruptly in the region of foveal cystic space, suggesting that this layer belongs to the neural retina. C, Magnification (×2) of the UHR-OCT image shows the thin, hyperreflective ERM above the nerve fiber layer. D, Magnification (×2) of the UHR-OCT image. An outer foveal cystic space appears to be the origin of the hyporeflective disruption in the outer retina. A small moderatively reflective foveal lesion is also visualized within the inner retina. The ELM and RPE remain intact across the macula. The previously unidentified hyperreflective layer (red asterisk) present between the IS/OS junction and RPE is abruptly disrupted at the cystic space in tandem with the IS/OS junction, suggesting that this layer belongs to the neural retina. Abbreviations are described in the legend to Figure 1.
