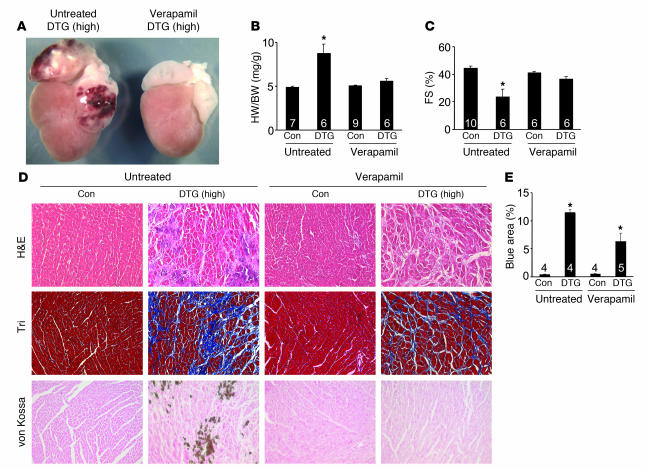
Figure 4. Verapamil reduces cardiac pathology in β2a DTG mice.
(A) Gross morphological view of hearts from a high-expressing DTG β2a mouse with or without verapamil treatment (4 months of age). (B) Heart weight normalized to body weight for control tTA single-transgenic and high-expressing DTG mice with or without verapamil. Numbers indicate the number of mice analyzed in each group. *P < 0.05 versus untreated control, ANOVA. (C) Fractional shortening assessment by echocardiography in control tTA single-transgenic and high-expressing DTG mice with or without verapamil. Numbers indicate the number of mice analyzed in each group. *P < 0.05 versus untreated control, ANOVA. (D) Histological assessment of cardiac ventricular pathology by H&E, Masson’s trichrome, and von Kossa staining in control tTA single-transgenic and high-expressing DTG mice with or without verapamil. Original magnification, ×200. (E) Quantitation of fibrotic area (blue) from trichrome-stained cardiac histological sections. Numbers indicate the number of sections analyzed in each group. *P < 0.05 versus control, ANOVA.

