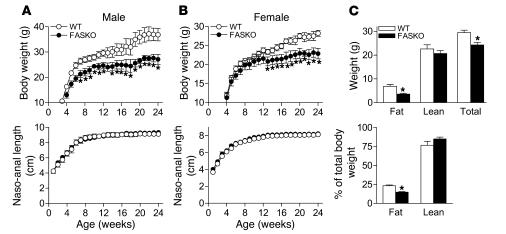
Figure 3. FASKO mice weigh less due to decreased fat mass.
(A and B) Body weight (top panels) and naso-anal length (bottom panels) with age in male and female WT and FASKO mice maintained on chow diet. Results are from 20–25 mice per genotype per sex. *P < 0.05 versus control. (C) Body composition of 16- to 20-week-old WT and FASKO male mice using dual energy x-ray absorptiometry represented as absolute mass (top panel) and as percentage of total body mass (bottom panel). Each bar represents the mean ± SEM of 12–15 animals per genotype. *P < 0.05 compared with WT.

