
Fig. 1.
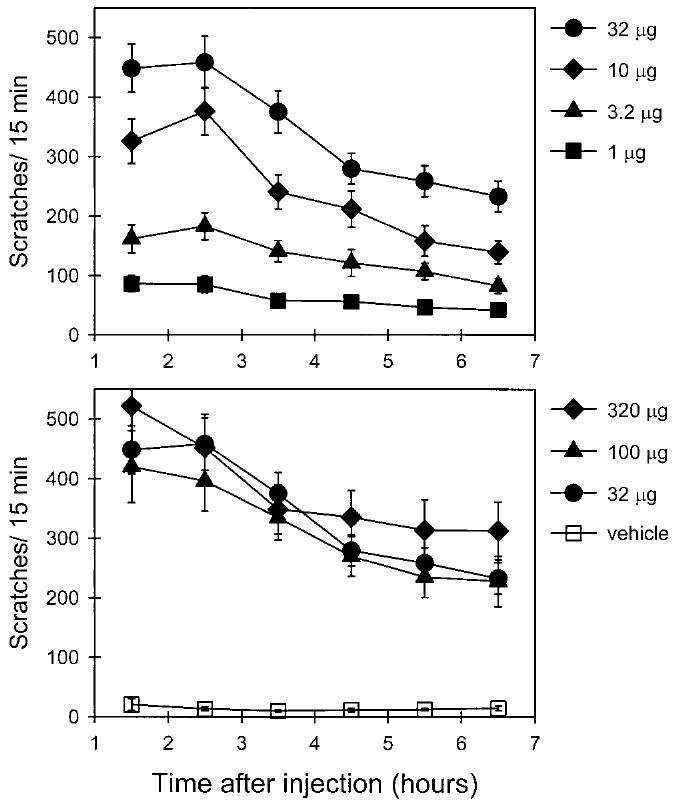
Average time course of intrathecal morphine-induced scratching responses in monkeys (n = 8). Each value represents the mean ± SEM (two to three replications). Abscissae (both panels): time (hours) after intrathecal injection. Ordinates (both panels): scratches per 15 min during each session. Solid symbols represent different doses (micrograms) of intrathecal morphine, and open squares represent the intrathecal vehicle (saline) injection. See figure 2 for individual dose-response curves of intrathecal morphine and Materials and Methods for other details.