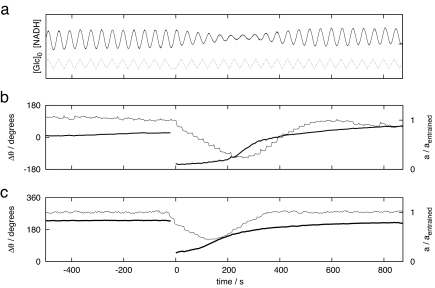
Fig. 1.
180° phase-shift experiments. Yeast cell populations are forced with either glucose (a and b) or Aca (c) at their natural frequency. Once the phase difference between the external forcing and the yeast cell oscillations is stable, the forcing phase is shifted 180° at time t = 0 s. (a) Fluorescence signal (solid line), which is proportional to [NADH], and the mixed flow glucose concentration with an average value of 19 mM and a half amplitude of 0.12 mM. The actual average glucose concentration is measured to 2.4 mM. (b) Time courses of the amplitude (thin line) and phase (heavy line) in the same experiment. (c) Time courses of the amplitude (thin line) and phase (heavy line) in a phase-shift experiment with Aca forcing at a forcing amplitude of a[Aca]0 = 2.0 μM. We report the phase relative to the phase of the forcing, Δθ = θforcing − θNADH, so that the phase is positive if the maximum of the forcing precedes the maximum of the NADH signal. The amplitude is reported relative to the amplitude of the entrained oscillations.

