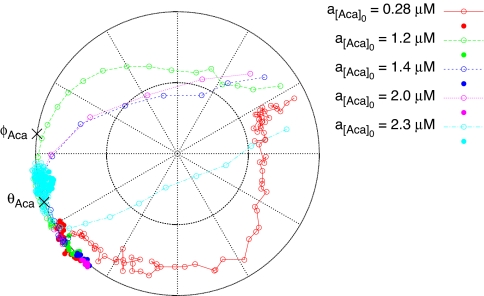
Fig. 3.
Phase and amplitude responses as seen in the 180° Aca phase-shift experiments (Table 1). The plot is a polar plot; the distance from the center indicates the NADH amplitude a relative to the fully entrained NADH amplitude aentrained, and the angle indicates the phase difference Δθ between the forcing and the NADH signal. Different experiments are indicated by color-coding. Filled symbols are states observed before the phase shift, and open symbols indicate states observed after it. The states in the plot are separated in time by 39 s, equivalent to one oscillation period. Hence, the distance between adjacent points on a trajectory indicates the speed along it. The phase of Aca oscillations θAca observed in nonforced yeast cell populations (5) and Aca's quenching phase φAca (10) are indicated by ×. For clarity, response curves are only drawn for a subset of the experiments.

