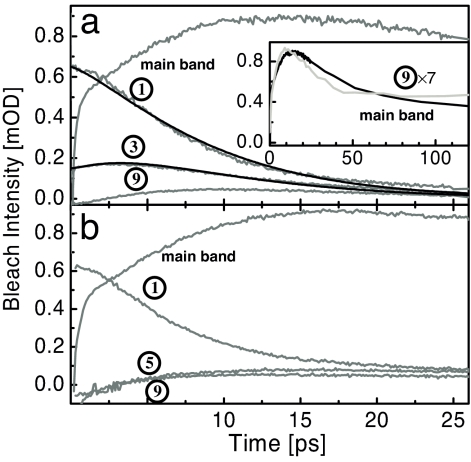
Fig. 3.
Time traces. Time dependencies of the bleach intensity (with opposite sign as in Fig. 2) of bands 1 to 9 and the main band, of PAZ-Aib-Ala*-Aib6-OMe (a) and PAZ-Aib3-Ala*-Aib4-OMe (b) (gray lines). The black lines show global fits according to a simple kinetic scheme (see Discussion). The inset in a shows the recovery of the main band on a longer timescale together with that of band 9 (the latter being up-scaled by a factor of 7).

