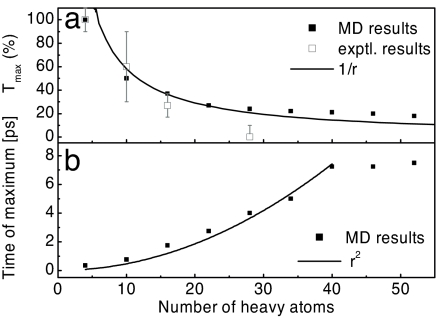
Fig. 5.
MD results. Maximal amplitudes (a) and peak times (b) of the energy transferred to residue Aibn from the raw MD data, plotted as a function of the number of heavy atoms along the peptide chain, together with 1/r and r2 fits. In a, the experimental results are included for comparison (open squares).

