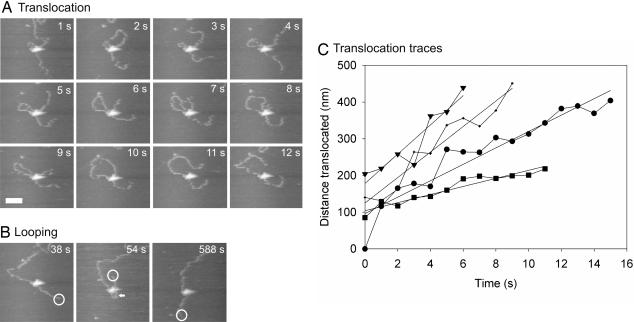
Fig. 2.
Translocation and extruded looping followed by diffusive looping by EcoP15I. Time-lapse images of an EcoP15I-DNA complex obtained at 1 frame per sec. The elapsed time is shown in each image. The image is cropped from an original scan size of 1,000 × 600 nm. (A) Translocation and formation of an extruded loop between 1 and 10 s, before release of the loop at 11 s. (Scale bar, 100 nm.) (B) Formation and release of a diffusive loop between 38 and 588 s. The loop is highlighted by an arrow. The presence of the loop can also be inferred from the large displacement of the DNA end, highlighted by an open circle. (C) Distance of DNA translocated by EcoP15I at various times, extracted from consecutive fast-scan AFM images. Each trace represents an independent experiment under identical conditions. The straight lines represent linear fits to each trace. See also SI Movie 2.

