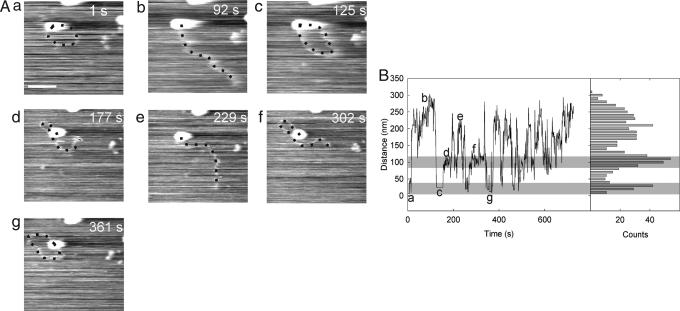
Fig. 4.
Dynamic, diffusive looping by EcoP15I. (A) Time-lapse images of an EcoP15I-DNA complex obtained at 1 frame per s. The image is cropped from an original scan size of 600 × 400 nm. (Scale bar, 100 nm.) (B) For all 729 images, collected in a 729-s interval, the distance between the enzyme center and the end of the DNA was measured and is shown in the trace, along with the histogram. The two distinct looping states are seen as peaks in the histogram. The regions they correspond to in the trace are highlighted by gray rectangles. The letters in the trace refer to the corresponding AFM images.

