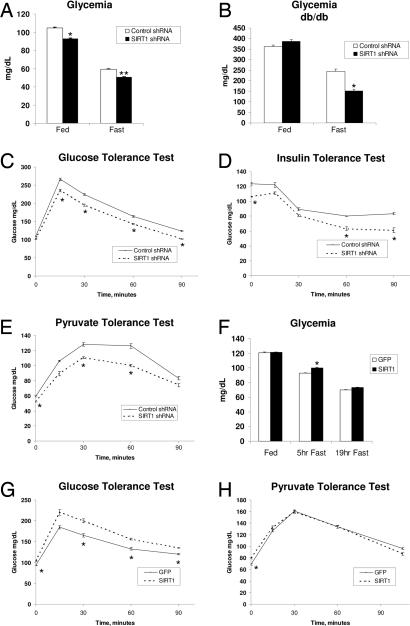
Fig. 1.
Hepatic SIRT1 controls glucose metabolism. (A) Fed and fasted blood glucose levels of control and SIRT1 shRNA-infected mice. Data are presented as the average ± SEM of two independent experiments. Shown are control shRNA-infected mice [fed (n = 12), 20-h fasted (n = 12)] and SIRT1 shRNA-infected mice [fed (n = 13), 20-h fasted (n = 12)]. (B) Blood glucose levels from db/db mice infected with control shRNA (n = 5) or SIRT1 shRNA (n = 5) during feeding and during a short fast. (C) GTT. Control shRNA-infected (n = 5) and SIRT1 shRNA-infected (n = 6) mice were fasted 5 h before i.p. injection of 2 g/kg dextrose. (D) ITT. Control shRNA-infected (n = 5) and SIRT1 shRNA-infected (n = 5) mice were fasted 5 h before i.p. injection of 0.6 unit/kg insulin. (E) PTT. Control shRNA-infected (n = 7) and SIRT1 shRNA-infected (n = 7) mice were fasted 18 h before i.p. injection of 2 g/kg sodium pyruvate. (F) Blood glucose levels from mice infected with GFP or SIRT1 overexpression adenovirus. Feeding GFP and SIRT1 (n = 12), following a short 5-h fast (n = 6) or following a 19-h fast (n = 12). (G) GTT from GFP-infected (n = 6) or SIRT1-infected (n = 6) mice fasted for 5 h before injection of 2 g/kg dextrose. (H) PTT from GFP-infected (n = 6) and SIRT1-infected (n = 6) mice fasted for 18 h before injection with 2 g/kg pyruvate. All tolerance tests were performed in at least two independent experiments with similar results. Data are presented as the average ± SEM. Significance was determined by Student's t test. *, P < 0.05; **, P < 0.01.

