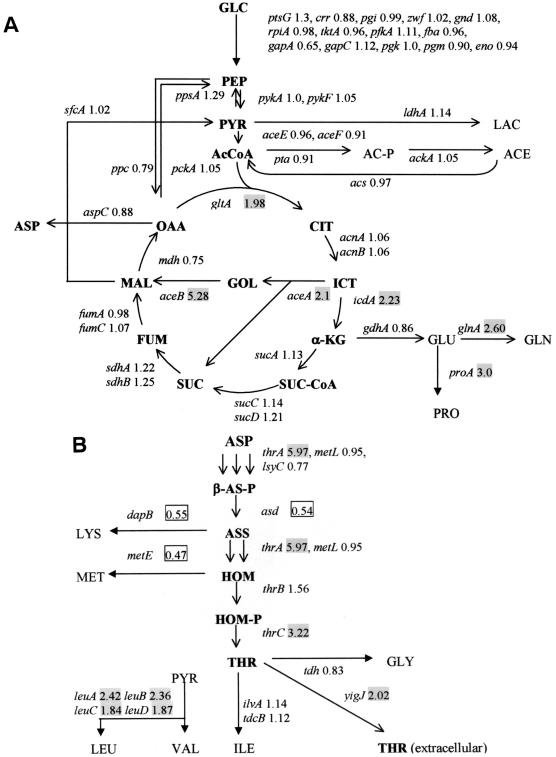
FIG. 3.
Metabolic map showing relative expression ratios (intensity of TF5015 versus that of W3110) of transcript levels in the central metabolic pathway (A) and the threonine biosynthetic pathway (B). Abbreviations: GLC, glucose; PEP, phosphoenolpyruvate; PYR, pyruvate; LAC, lactate; Ac-CoA, acetyl-CoA; AC-P, acetyl-phosphate; ACE, acetate; CIT, citrate; ICT, isocitrate; α-KG, α-ketoglutarate; SUC-CoA, succinyl-CoA; FUM, fumarate; MAL, malate; OAA, oxaloacetate; GOL, glyoxylate; GLU, glutamate; GLN, glutamine; PRO, proline; ASP, aspartate; LYS, lysine; MET, methionine; β-AS-P, β-aspartyl phosphate; ASS, aspartate semialdehyde; HOM, homoserine; HOM-P, homoserine phosphate; THR, threonine; GLY, glycine; ILE, isoleucine; LEU, leucine; VAL, valine. The shaded and boxed numbers in the figure represent up- and downregulated genes, respectively, in TF5015.

