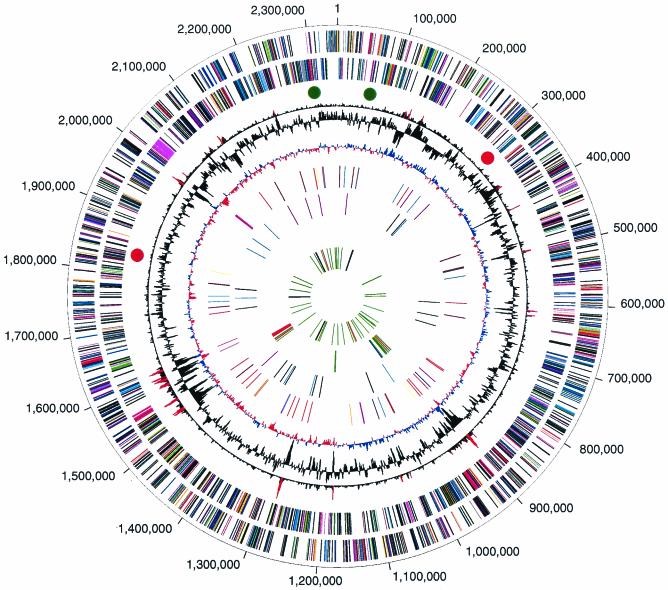
FIG. 1.
Circular representation of the P. gingivalis genome. The outer circle shows the predicted coding regions on the plus strand color-coded by role categories as follows: violet, amino acid biosynthesis; light blue, biosynthesis of cofactors, prosthetic groups, and carriers; light green, cell envelope; red, cellular processes; brown, central intermediary metabolism; yellow, DNA metabolism; light gray, energy metabolism; magenta, fatty acid and phospholipid metabolism; pink, protein synthesis and fate; orange, purines, pyrimidines, nucleosides, and nucleotides; olive, regulatory functions and signal transduction; dark green, transcription; teal, transport and binding proteins; gray, unknown function; salmon, other categories; blue, hypothetical proteins. The second circle shows the predicted coding regions on the minus strand. The third circle presents the χ2 analysis of atypical nucleotide composition; χ2 values of >600 are indicated in red. The fourth circle shows the %G+C. The fifth circle shows atypical nucleotide composition (GC skew). The sixth circle shows the IS elements, indicated by color as follows: orange, ISPg1; light green, ISPg2; magenta, ISPg3; cyan, ISPg4; brown, ISPg5; gold, ISPg6; blue-green, ISPg7; pink, ISPg8; and violet, ISPg9; salmon, ISPg10; olive, ISPg11. The seventh circle shows MITE239 (magenta), MITE700 (cyan), and MITE464 (black). The eighth circle shows Tn4555 (blue), CTn (red), and other transposable elements (green). The ninth circle shows tRNA (green), rRNA (black), and sRNA (red).

