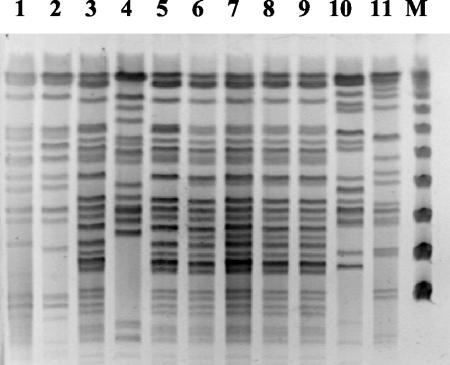
FIG. 3.
PFGE profiles of B. cepacia isolates. Restriction digestion profiles generated using XbaI are shown for ET12 strain K56-2 (lane 1), ET12 strain J2315 (lane 2), isolates of fliC RFLP group I and recA RFLP pattern G that share a RAPD profile (lanes 3, 5, 6, 7, 8, and 9), an isolate of a different fliC RFLP group but with recA RFLP pattern G (lane 4), and isolates of fliC RFLP group I and recA RFLP pattern G that share a different RAPD profile (lanes 10 and 11). Isolates used for the PFGE profiles in lanes 3, 5, 6, 7, 8, and 9 are representatives of the common clone sharing features with but differing from the ET12 lineage. M, pulse marker, 50 to 1,000 kb (Sigma-Aldrich).

