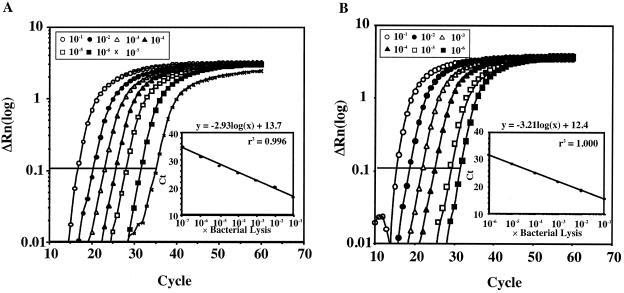
FIG. 1.
Amplification plots of chromosomal DNA from lysed cells. Serial dilutions of chromosomal DNA were from S. mutans (A) or S. sobrinus (B). The log-transformed relative fluorescence [ΔRn(log)] was monitored as the increase in reporter dye intensity relative to the passive internal reference dye. The threshold fluorescence, or level at which the threshold cycle was determined, is shown. The standard curves were generated from the amplification plots in the small panels (correlation coefficient = 0.996 for S. mutans and 1.00 for S. sobrinus). Ct is the cycle number at which the threshold fluorescence was reached.

