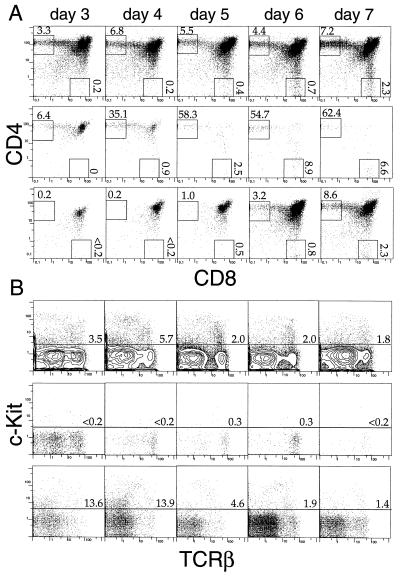
Figure 4.
In vivo differentiation of MHC-DKO thymocytes after i.t. injection into MHC+/+ hosts. (A) CD4/CD8 profiles of progeny from unfractionated (Top), sorted DPhic-Kit− (Middle), and DN/DPloc-Kit+ thymocytes (Bottom) from MHC-DKO mice after i.t. injection. (B) TCRβ/c-Kit profiles of progeny from unfractionated (Top), sorted DPhic-Kit− (Middle), and DN/DPloc-Kit+ thymocytes (Bottom) from MHC-DKO mice after i.t. injection. Numbers indicate percentages of gated fractions.

