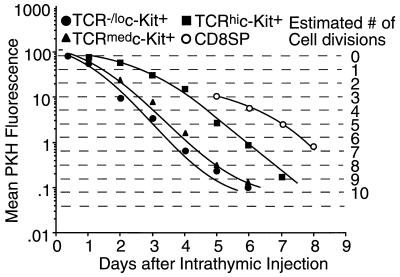
Figure 6.
Changes of PKH26 signal intensity in TCR/c-Kit-defined subsets from MHC-DKO mice after i.t. injection to MHC+/+ hosts. The estimated numbers of cell divisions are shown as broken lines. Each dot stands for the mean signal intensity of each population. There was a wide variation of PKH26 intensities in each subset.

