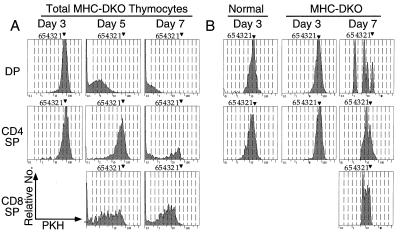
Figure 7.
The PKH26 profile in CD4 SP and CD8 SP progeny after i.t. injection. (A) Serial changes of PKH26 profiles after i.t. injection of PKH26-stained total thymocytes from MHC-DKO mice. (B) Serial changes of PKH26 profiles after i.t. injection of PKH26-stained DPhic-Kit− (TCRlo-med) thymocytes from MHC-DKO mice and normal mice. Vertical broken lines correspond to the 50% decrease of fluorescence intensity of PKH26. The numbers above each panel depict the estimated numbers of cell divisions as determined by the decline of PKH26 intensity.

