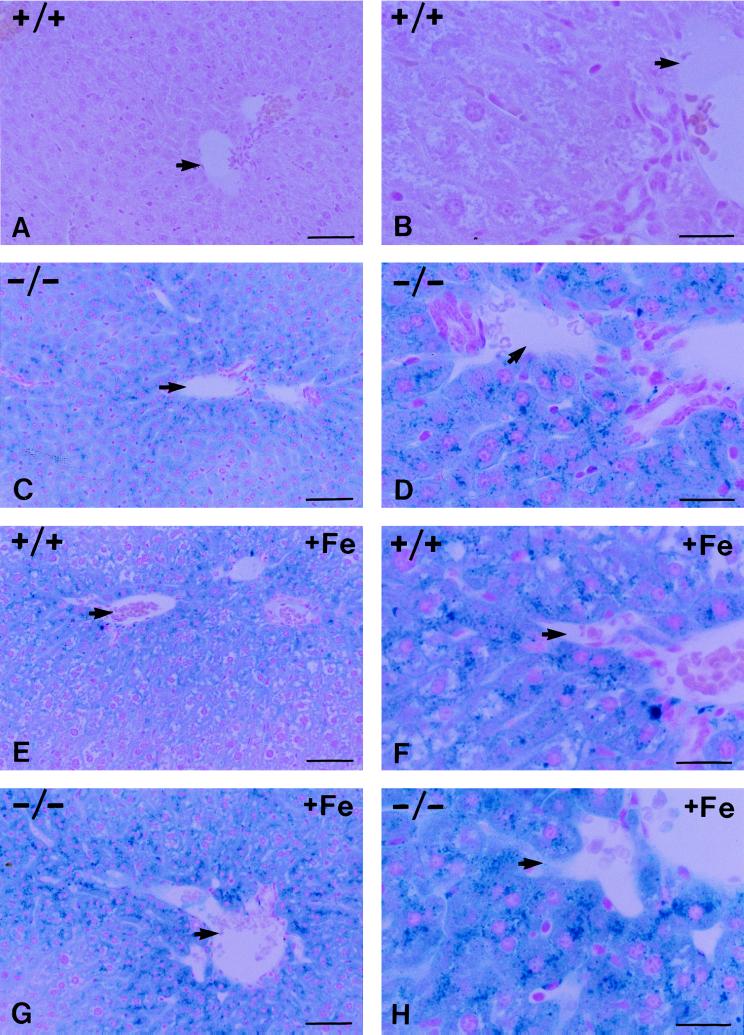
Figure 3.
Perls’ Prussian blue staining of liver sections from HFE+/+ and HFE−/− mice fed control diet (A–D) or control diet supplemented with 2% (wt/wt) carbonyl iron (E–H). Shown are low-power views (A, C, E, and G) and high-power views (B, D, F, and H) of sections. A and B show the absence of stainable iron in the +/− mouse liver fed the control diet. C and D show prominent stainable iron in hepatocytes with periportal predominance in liver from HFE−/− mice fed the control diet. E and F show iron accumulation in HFE+/+ mouse liver in response to iron loading. G and H show the stainable iron in the HFE−/− mice after 2 weeks of feeding with the iron-supplemented diet. The arrows indicate the location of branches of the portal vein. (Bars: A, C, E, and G = 50 μm in the low-power views; B, D, F, and H = 20 μm in the high-power views.)

