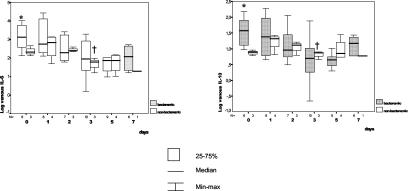
FIG. 2.
Bacteremic and nonbacteremic pneumococcal pneumonias. Daily and time course comparisons of plasma IL-6 and IL-10 concentrations are shown. An asterisk indicates a statistically significant difference in the comparisons of groups, as determined by the Mann-Whitney U test. A dagger indicates a statistically significant difference in relation to basal values, as determined by the Kruskal-Wallis one-way analysis of variance nonparametric test. For P values, see the text. The pairs of small numbers appearing just below the horizontal axis represent the numbers of observations in the subgroups of patients at different time intervals from admission. Min-max, minimum-maximum.

