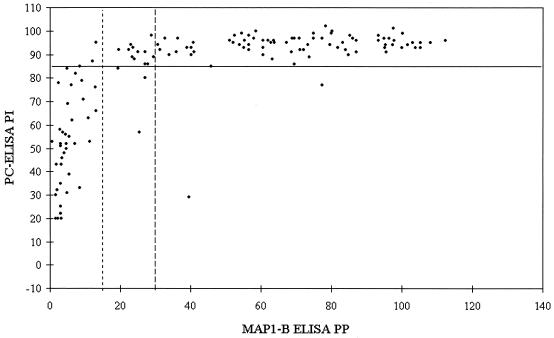
FIG. 2.
Scatter plot of paired PI values (y axis; solid line indicates cutoff of 85 PI) obtained with PC-ELISA and PP values (x axis; dotted line on left indicates cutoff of 14 PP, and broken line on right indicates cutoff of 29 PP) obtained with MAP1-B ELISA for sera (n = 133) from point prevalence survey adult sheep.

