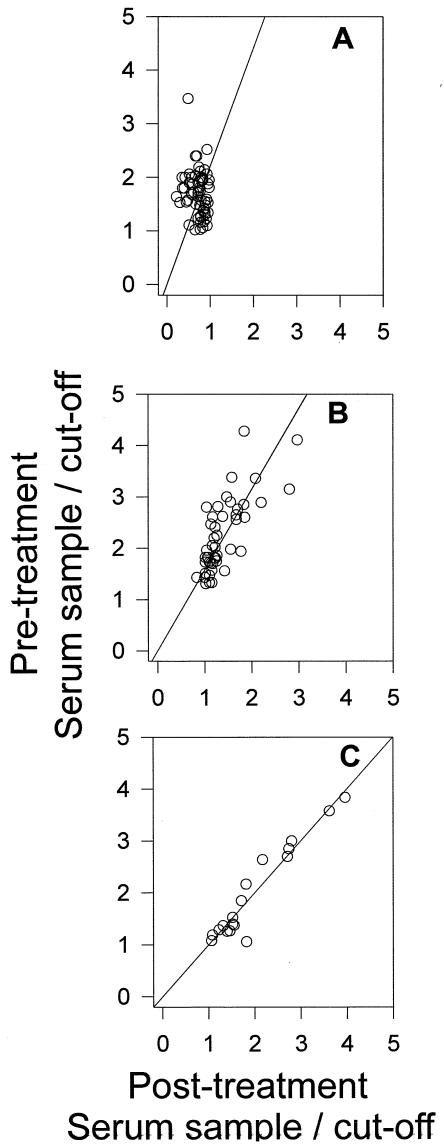
FIG. 3.
Distribution of reactivities of sera from each group of patients. Each point represents the reactivity of each serum sample before and after benznidazole treatment (second serum sample). (A) Chronic Chagas' disease patients with successful therapy; (B) chronic Chagas' disease patients with decreases in titers after treatment; (C) chronic Chagas' disease patients with resistance to treatment.

