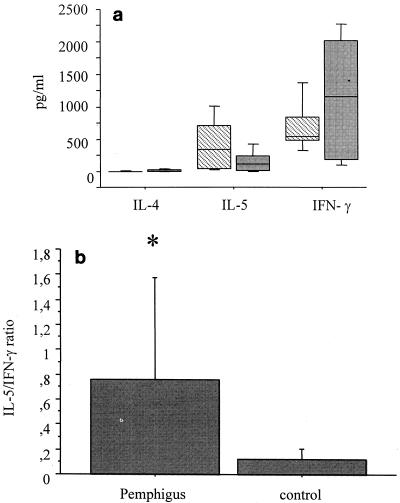
FIG. 2.
Production of regulatory cytokines after stimulation with PHA. PBMCs from patients (hatched bars) and control subjects (gray bars) were cultured in the presence of PHA for 120 h. (a) The cytokine levels in the supernatants (in picograms per milliliter) were determined by ELISA. Horizontal lines represent median values, boxes represent 25th to 75th percentiles, and vertical lines represent 10th to 90th percentiles. (b) IL-5/IFN-γ ratios were obtained by dividing the IL-5 levels by the IFN-γ levels in cultured supernatants stimulated with PHA. Bars represent averages, and vertical lines represent standard deviations. Statistical significance between groups is indicated (*, P < 0.05, the Student t test).

